
 menu")
What is the World Poverty Index - what is the Welt hunger Index
There are different indices to show and classify poverty and hunger in individual countries. On this page we explain the difference between the World Poverty Index and the World Hunger Index. Furthermore, you will learn in the text, what significance hunger and poverty have worldwide and how individual countries are affected in detail.
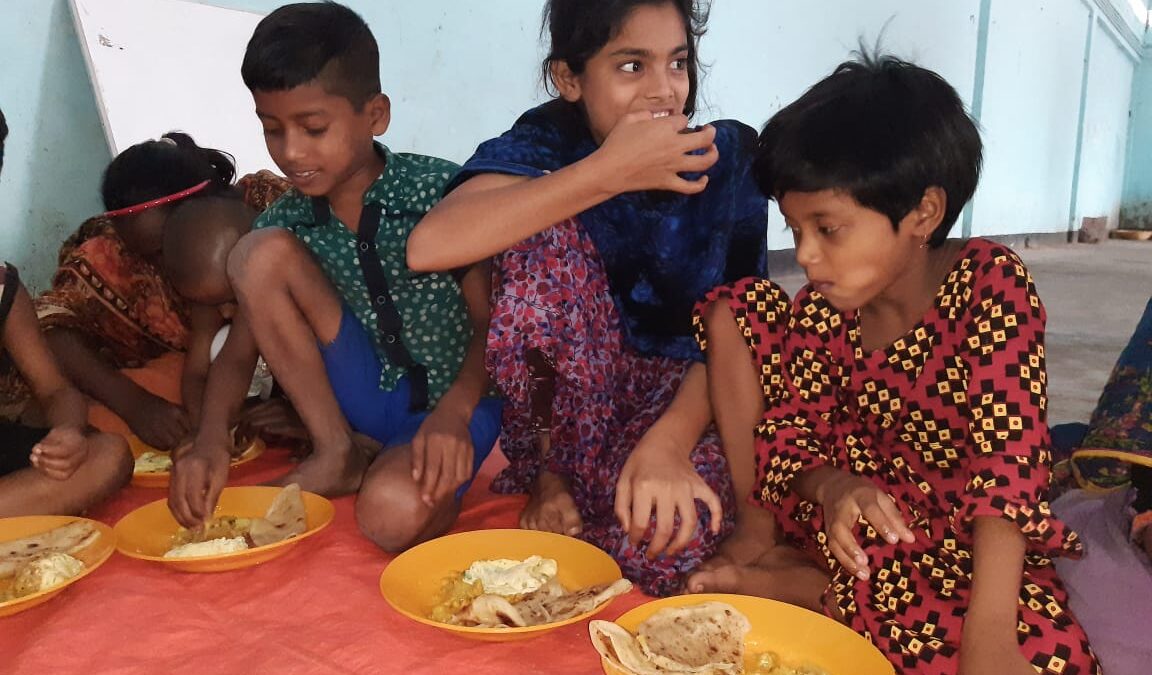
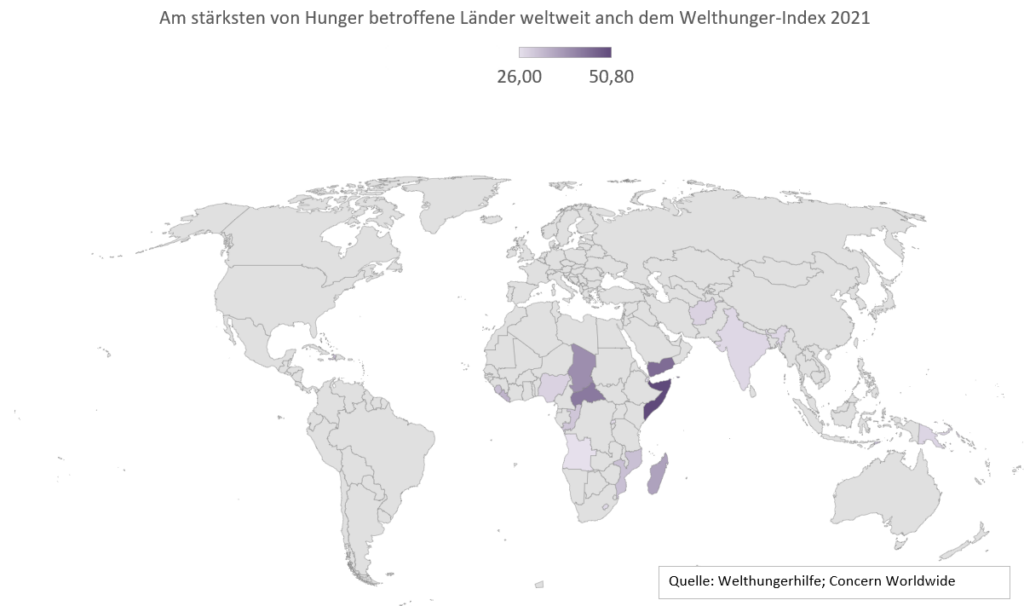
On the world map, it is very clear that hunger is mainly in Africa and South Asia. These areas are also the focus of our support. Our goal is to bring aid to the regions that need our support the most.
Hunger
What is hunger?
Having enough food on your plate every day to be in good health is not a given for everyone in the world. But in order to lead a healthy and productive life, everyone needs a certain intake of calories. According to the FAO (UN Food and Agriculture Organization), we should consume between 1,660 and 2,050 kilocalories a day, through balanced and healthy foods. If this is not given, then there is malnutrition or undernutrition. As a result, people suffer from hunger. In 2021, this affected around 811 million people.
Indicators
How do we recognize hunger?
In order to be able to measure and compare hunger worldwide, various indicators in the population are taken into account, corresponding values are calculated and put into perspective. This results in the World Hunger Index (WHI), which is published annually by Welthungerhilfe and Alliance2015 partner Concern Worldwide. The corresponding figures are collected per country - if this is possible. In 2021, no reliable data on the WHI could be collected for 19 countries, so that no statement on the World Hunger Index can be made about Belarus, Croatia and China, among others.
For the calculation of the World Hunger Index, the following indicators of country population are taken into account:
- Malnutrition: This occurs when there is insufficient food intake and describes the lack of vital nutrients such as proteins, vitamins and minerals. Causes of malnutrition can be the quantity or quality of food, as well as poor nutrient utilization due to illness. This in turn can be caused by poor health care, lack of access to water and sanitation, or lack of access to food in the home. The World Hunger Index uses the percentage of a country's total population that is undernourished, i.e. children and adults.
- Emaciation in childhood: For this indicator, the weight of children under the age of 5 is set in relation to their height. If this does not correspond to the normal weight, the children are wasted. This is acute malnutrition for a limited period of time, for example during droughts, wars or disasters.
- Growth retardation in children: Here, body size is compared with age. If a child is too small for his or her age and thus exhibits growth retardation, the term "stunted" is used. These health consequences are due to chronic malnutrition in childhood and cannot be reversed. If acute malnutrition is then added to this for the affected children, their lives are threatened.
- Mortality rate of children under 5 years of age: When children do not have enough to eat, death is the most serious effect of hunger.
| WHI Index | Evaluation |
|---|---|
| ≥ 50 | Countries with a serious WHI value |
| 35-49,9 | Countries with a very serious WHI value |
| 20-34,9 | Countries with a serious WHI value |
| 10-19,9 | Countries with a moderate WHI value |
| ≤9,9 | Countries with a low WHI value |
The higher the value, the greater the hunger locally - 0 therefore means "no hunger" and anything above the value 50 is defined as "serious". A value of 100 would mean that all values in the country would be equal to the highest value measured the year before.
Data for the World Hunger Index are provided by various United Nations agencies as well as other multilateral stakeholders. These include, for example, the FAO, the World Health Organization (WHO), UNICEF and Demographic and Health Surveys (DHS). The World Hunger Index always takes into account the most recent data available. These are also used for estimates if original data are not available.
Numbers
Hunger in numbers
With all the numbers and calculation, the question arises: can hunger be measured at all and what does that say about the country and the development opportunities of the local people?
The main criticism of the WHI is that the data collected on the indicators are not sufficiently reliable. This is shown by the fact that in many countries no data can be collected at all because of wars or unrest. Even in countries with very small populations (e.g. Belize), no data is collected.
This sometimes means that in one year, data from 2017 is included in the WHI for one country, but from 2019 in another. It would therefore also be theoretically possible that in a country without data collection, the situation is even worse than the occupied values at the last place in the ranking of the World Hunger Index.
In addition, the calculation matrix means that the World Hunger Index for one year cannot be compared with the previous year. This is partly because the number of comparable countries can vary from year to year - and so can the values used in the calculation for standardizing the indicators. Instead, the values can be compared with the reference years 2000, 2006 and 2012.
The significance is therefore only strong for a specific year, but there it shows the worst global hunger situations as well as positive developments for some nations.
We have summarized some data on the World Hunger Index and other key figures in this table:
| Country | WHI 2021 | Population under $1.90 per day | Population under $3.20 per day | Population under $5.50 per day | Year | Literacy rate 2015 | Infant mortality per 1,000 births 2016 | Life expectancy 2016 |
|---|---|---|---|---|---|---|---|---|
| Egypt | 12,5 | 3,8 % | 28,9 % | 72,6 % | 2017 | 38,2 % | 22,8 | 72,7 |
| Albania | 6,2 | 1,3 % | 8,2 % | 33,8 % | 2017 | 97,6 % | 13,5 | 78,3 |
| Algeria | 6,9 | 0,5 % | 3,9 % | 29,2 % | 2011 | 80,2 % | 25,2 | 76,8 |
| Angola | 26,0 | 49,9 % | 71,5 % | 88,5 % | 2018 | 71,1 % | 82,5 | 56,0 |
| Argentina | 5,3 | 1,5 % | 4,9 % | 14,4 % | 2019 | 98,1 % | 11,1 | 77,1 |
| Armenia | 7.2 | 1,4 % | 12,3 % | 50,0 % | 2017 | 99,8 % | 13,4 | 74,6 |
| Azerbaijan | 7,5 | 0,5 % | 2,7 % | 18,8 % | 2008 | 99,8 % | 30,9 | 72,5 |
| Ethiopia | 24,1 | 27,3 % | 62,2 % | 85,0 % | 2015 | 49,1 % | 58,4 | 62,2 |
| Australia | 0,5 % | 0,7 % | 0,7 % | 2014 | >99,9 % | 3,7 | 82,2 | |
| Bangladesh | 19,1 | 14,8 % | 52,9 % | 84,5 % | 2016 | 61,5 % | 34,2 | 73,2 |
| Belarus | ≤5,0 | 0,0 % | 0,0 % | 0,2 % | 2019 | 99,7 % | 3,9 | 72,7 |
| Belgium | 0,1 % | 0,1 % | 0,2 % | 2018 | >99,9 % | 3,9 | 81,0 | |
| Benin | 22,2 | 49,8 % | 76,2 % | 90,6 % | 2015 | 38,4 % | 97,6 | 61,9 |
| Bhutan | 1,5 % | 12,0 % | 38,6 % | 2017 | 64,9 % | 32,4 | 70,1 | |
| Bolivia | 12,7 | 5,8 % | 11,8 % | 24,7 % | 2017 | 95,7 % | 36,9 | 69,2 |
| Bosnia and Herzegovina | ≤5 | 0,1 % | 0,6 % | 3,5 % | 2011 | 98,5 % | 6,0 | 76,7 |
| Botswana | 23,2 | 16,1 % | 38,5 % | 60,4 % | 2015 | 88,5 % | 40,6 | 54,5 |
| Brazil | ≤5,0 | 4,6 % | 9,1 % | 19,7 % | 2019 | 92,6 % | 15,1 | 73,8 |
| Bulgaria | 6,1 | 0,9 % | 2,2 % | 6,9 % | 2018 | 98,4 % | 7,6 | 74,5 |
| Burkina Faso | 24,5 | 43,4 % | 76,4 % | 92,3 % | 2014 | 36,0 % | 84,6 | 55,5 |
| Burundi | 35,0 – 49,9 | 73,7 % | 90,1 % | 97,1 % | 2013 | 85,6 % | 71,7 | 60,5 |
| Chile | ≤5,0 | 0,7 % | 1,8 % | 6,4 % | 2017 | 97,3 % | 8,3 | 78,8 |
| People's Republic of China | ≤5,0 | 0,5 % | 5,4 % | 24,0 % | 2016 | 96,4 % | 9,9 | 75,5 |
| Costa Rica | 5,3 | 1,0 % | 2,7 % | 9,7 % | 2017 | 97,8 % | 8,8 | 78,6 |
| Denmark | 0,2 % | 0,2 % | 0,3 % | 2018 | >99,9 % | 4,4 | 79,4 | |
| Germany | 0,0 % | 0,2 % | 0,5 % | 2016 | >99,9 % | 3,8 | 80,7 | |
| Dominican republic | 8,0 | 0,6 % | 2,7 % | 12,4 % | 2019 | 91,8 % | 30,7 | 78,1 |
| Djibouti | 27,4 | 17,1 % | 40,2 % | 70,6 % | 2017 | 64,2 | 63,2 | |
| Ecuador | 14,0 | 4,8 % | 10,8 % | 29,9 % | 2017 | 94,5 % | 20,9 | 76,8 |
| El Salvador | 8,9 | 1,9 % | 9,8 % | 31,6 % | 2015 | 88,4 % | 15,0 | 74,4 |
| Ivory Coast | 24,5 | 27,9 % | 57,0 % | 81,8 % | 2015 | 43,1 % | 91,8 | 58,7 |
| Estland | ≤5,0 | 0,2 % | 0,5 % | 0,8 % | 2018 | 99,8 % | 2,9 | 76,7 |
| Eswatini | 17,0 | 29,2 % | 52,1 % | 72,0 % | 2016 | 87,5 % | 70,4 | 51,6 |
| Fiji | 8,6 | 1,5 % | 14,5 % | 49,6 % | 2015 | 72,7 | ||
| Finland | 0,1 % | 0,1 % | 0,2 % | 2018 | >99,9 % | 2,3 | 80,9 | |
| France | 0,0 % | 0,0 % | 0,1 % | 2018 | >99,9 % | 3,9 | 81,9 | |
| Gabon | 16,6 | 3,4 % | 11,3 % | 32,4 % | 2017 | 83,2 % | 47,4 | 52,1 |
| Gambia | 17,6 | 10,3 % | 38,4 % | 72,7 % | 2015 | 55,5 % | 65,3 | 64,9 |
| Georgia | 6,3 | 3,8 % | 14,9 % | 42,0 % | 2019 | 99,8 % | 10,7 | 76,2 |
| Ghana | 14,9 | 13,3 % | 30,5 % | 56,9 % | 2016 | 76,6 % | 58,8 | 66,6 |
| Greece | 0,1 % | 0,3 % | 2,9 % | 2018 | 97,7 % | 3,8 | 80,5 | |
| Guatemala | 19,6 | 9,5 % | 25,3 % | 50,1 % | 2014 | 79,3 % | 28,5 | 72,3 |
| Guinea | 20,0 – 34,9 | 35,3 % | 70,3 % | 92,3 % | 2012 | 30,4 % | 89,0 | 60,6 |
| Guinea-Bissau | 20,0 – 34,9 | 67,1 % | 84,5 % | 93,4 % | 2010 | 59,9 % | 88,1 | 50,6 |
| Haiti | 32,8 | 24,9 % | 51,0 % | 79,0 % | 2012 | 60,7 % | 67,0 | 63,8 |
| Honduras | 12,8 | 17,2 % | 31,6 % | 52,6 % | 2017 | 88,5 % | 18,7 | 71,1 |
| India | 27,5 | 21,2 % | 60,4 % | 86,8 % | 2011 | 71,2 % | 43,0 | 68,5 |
| Indonesia | 18,0 | 2,7 % | 19,9 % | 52,2 % | 2019 | 93,9 % | 26,4 | 72,7 |
| Iraq | 22,8 | 1,7 % | 14,8 % | 52,4 % | 2012 | 79,7 % | 31,2 | 74,9 |
| Iran | 7,7 | 0,5 % | 3,1 % | 14,0 % | 2018 | 86,8 % | 15,1 | 71,4 |
| Ireland | 0,2 % | 0,5 % | 0,8 % | 2018 | >99,9 % | 3,6 | 80,8 | |
| Iceland | 0,0 % | 0,0 % | 0,0 % | 2017 | >99,9 % | 2,1 | 83,0 | |
| Israel | 0,2 % | 0,7 % | 2,7 % | 2016 | >99,9 % | 3,5 | 82,4 | |
| Italy | 1,4 % | 1,8 % | 3,1 % | 2017 | 99,2 % | 3,3 | 82,2 | |
| Jamaica | 8,6 | 1,7 % | 8,9 % | 29,4 % | 2004 | 88,7 % | 15,3 | 73,8 |
| Japan | 0,7 % | 0,9 % | 1,2 % | 2013 | >99,9 % | 2,7 | 85,0 | |
| Yemen | 45,1 | 18,8 % | 52,2 % | 81,6 % | 2014 | 70,1 % | 55,5 | 65,5 |
| Jordan | 8,8 | 0,1 % | 2,1 % | 18,1 % | 2010 | 96,7 % | 17,6 | 74,6 |
| Cameroon | 18,6 | 24,0 % | 45,0 % | 69,2 % | 2014 | 75,0 % | 79,7 | 58,5 |
| Canada | 0,2 % | 0,5 % | 0,7 % | 2017 | >99,9 % | 4,9 | 81,9 | |
| Cape Verde | 8,1 % | 26,5 % | 53,1 % | 2007 | 87,6 % | 72,1 | ||
| Kazakhstan | 6,4 | 0,0 % | 0,4 % | 8,6 % | 2017 | 99,8 % | 11,4 | 70,8 |
| Kenya | 23,0 | 36,8 % | 66,2 % | 86,5 % | 2015 | 78,0 % | 49,2 | 64,0 |
| Kyrgyzstan | 8,6 | 1,5 % | 19,6 % | 66,4 % | 2017 | 99,5 % | 21,1 | 70,7 |
| Colombia | 8,9 | 3,9 % | 13,1 % | 27,6 % | 2017 | 94,7 % | 15,3 | 75,7 |
| Comoros | 35,0 – 49,9 | 17,7 % | 36,9 % | 63,1 % | 2013 | 77,8 % | 64,2 | |
| Democratic Republic of the Congo | 39,0 | 77,1 % | 91,3 % | 97,8 % | 2012 | 77,3 % | 94,3 | 57,3 |
| Republic of the Congo | 30,3 | 37,0 % | 61,3 % | 82,4 % | 2011 | 79,3 % | 54,1 | 59,3 |
| South Korea | 0,2 % | 0,2 % | 0,7 % | 2016 | >99,9 % | 3,4 | 82,4 | |
| Kosovo | 0,4 % | 3,6 % | 24,4 % | 2017 | 91,9 % | |||
| Croatia | ≤5,0 | 0,4 % | 0,7 % | 2,4 % | 2018 | 99,3 % | 4,7 | 75,9 |
| Laos | 19,5 | 10,0 % | 37,4 % | 70,4 % | 2018 | 79,9 % | 63,9 | 64,3 |
| Lesotho | 27,4 | 27,2 % | 49,9 % | 73,2 % | 2017 | 79,4 % | 93,5 | 53,0 |
| Latvia | ≤5,0 | 0,5 % | 0,9 % | 3,0 % | 2014 | >99,9 % | 4,6 | 74,5 |
| Lebanon | 9,7 | 0,0 % | 0,1 % | 2,0 % | 2013 | 93,9 % | 8,1 | 77,6 |
| Liberia | 33,3 | 40,9 % | 72,6 % | 92,2 % | 2016 | 47,6 % | 67,4 | 59,0 |
| Lithuania | ≤5,0 | 0,9 % | 1,3 % | 2,4 % | 2018 | 99,8 % | 5,3 | 74,9 |
| Luxembourg | 0,3 % | 0,4 % | 0,6 % | 2018 | >99,9 % | 2,4 | 82,3 | |
| Madagascar | 36,3 | 77,8 % | 91,1 % | 97,3 % | 2012 | 64,7 % | 46,4 | 65,9 |
| Malawi | 21,3 | 70,3 % | 89,4 % | 96,7 % | 2016 | 65,8 % | 55,1 | 61,2 |
| Malaysia | 12,8 | 0,0 % | 0,2 % | 2,7 % | 2015 | 94,6 % | 8,3 | 75,0 |
| Maldives | 7,3 % | 24,4 % | 54,3 % | 2009 | 99,3 % | 75,6 | ||
| Mali | 24,8 | 49,3 % | 79,0 % | 94,8 % | 2009 | 38,7 % | 110,6 | 55,8 |
| Morocco | 8,8 | 0,9 % | 7,3 % | 30,2 % | 2013 | 72,4 % | 27,1 | 76,9 |
| Mauritania | 22,6 | 5,9 % | 23,6 % | 58,3 % | 2014 | 52,1 % | 81,4 | 63,0 |
| Mauritius | 12,2 | 0,2 % | 2,2 % | 12,7 % | 2017 | 90,6 % | 75,6 | |
| Mexico | 8,5 | 1,7 % | 6,5 % | 22,7 % | 2018 | 94,4 % | 75,9 | |
| Moldova | 0,0 – 9,9 | 0,1 % | 1,1 % | 16,3 % | 2017 | 99,4 % | 15,9 | 70,7 |
| Mongolia | 6,1 | 0,5 % | 5,0 % | 27,1 % | 2018 | 98,4 % | 17,9 | 69,6 |
| Montenegro | ≤5,0 | 0,0 % | 0,8 % | 4,8 % | 2014 | 98,7 % | 3.8 | |
| Mozambique | 33,3 | 63,7 % | 82,4 % | 92,2 % | 2014 | 58,8 % | 71,3 | 53,3 |
| Myanmar | 17,5 | 6,5 % | 30,2 % | 67,9 % | 2015 | 93,1 % | 50,8 | 66,6 |
| Namibia | 20,2 | 13,8 % | 30,3 % | 51,0 % | 2015 | 81,9 % | 45,2 | 63,6 |
| Nepal | 19,1 | 15,0 % | 50,9 % | 83,0 % | 2010 | 64,7 % | 34,5 | 70,7 |
| Nicaragua | 14,0 | 3,6 % | 13,8 % | 36,4 % | 2014 | 82,8 % | 19,7 | 73,2 |
| Netherlands | 0,1 % | 0,2 % | 0,3 % | 2018 | >99,9 % | 3,8 | 81,3 | |
| Niger | 45,5 % | 77,5 % | 93,9 % | 2014 | 19,1 % | 91,3 | 55,5 | |
| Nigeria | 28,3 | 39,1 % | 71,0 % | 92,0 % | 2018 | 59,6 % | 104,3 | 53,4 |
| North Macedonia | ≤5,0 | 3,4 % | 7,1 % | 17,9 % | 2018 | 97,8 % | 12,2 | 76,2 |
| Norway | 0,3 % | 0,3 % | 0,4 % | 2018 | >99,9 % | 2,6 | 81,8 | |
| Austria | 0,6 % | 0,7 % | 1,0 % | 2018 | >99,9 % | 3,5 | 81,5 | |
| East Timor | 32,4 | 34,5 % | 60,2 % | 77,5 % | 2013 | 67,5 % | 49,7 | 68,1 |
| Pakistan | 24,7 | 4,4 % | 35,6 % | 76,2 % | 2018 | 56,4 % | 78,8 | 67,7 |
| Palestine | 1,0 % | 5,0 % | 23,6 % | 2016 | 19,4 | |||
| Panama | 7,2 | 2,5 % | 6,3 % | 14,1 % | 2017 | 95,0 % | 16,4 | 78,6 |
| Papua New Guinea | 27,8 | 38,0 % | 65,6 % | 86,9 % | 2009 | 64,2 % | 54,3 | 67,2 |
| Paraguay | 7,5 | 1,2 % | 5,6 % | 18,6 % | 2017 | 95,6 % | 19,9 | 77,2 |
| Peru | 8,0 | 2,2 % | 7,5 % | 20,6 % | 2019 | 94,5 % | 15,3 | 73,7 |
| Philippines | 16,8 | 2,7 % | 17,0 % | 46,9 % | 2018 | 96,2 % | 27,1 | 69,2 |
| Poland | 0,2 % | 0,4 % | 1,1 % | 2018 | 99,8 % | 4,7 | 77,6 | |
| Portugal | 0,3 % | 0,7 % | 1,7 % | 2018 | 95,4 % | 3,5 | 79,3 | |
| Rwanda | 26,4 | 55,5 % | 79,7 % | 91,6 % | 2016 | 70,5 % | 38,5 | 60,1 |
| Romania | ≤5,0 | 2,4 % | 5,1 % | 10,9 % | 2018 | 98,8 % | 9,0 | 75,1 |
| Russia | 6,2 | 0,0 % | 0,4 % | 3,7 % | 2018 | 99,7 % | 7,7 | 70,3 |
| Solomons | 18,8 | 25,1 % | 58,8 % | 84,7 % | 2013 | 84,1 % | 25,8 | 75,3 |
| Zambia | 57,5 % | 74,3 % | 87,2 % | 2015 | 63,4 % | 63,4 | 52,5 | |
| São Tomé und Príncipe | 32,3 % | 70,1 % | 92,3 % | 2010 | 74,9 % | 33,8 | 64,9 | |
| Sweden | 0,7 % | 0,9 % | 1,2 % | 2018 | >99,9 % | 2,9 | 82,1 | |
| Switzerland | 0,0 % | 0,0 % | 0,1 % | 2018 | >99,9 % | 4,1 | 82,6 | |
| Senegal | 38,0 % | 67,5 % | 88,1 % | 2011 | 55,7 % | 471,0 | 61,7 | |
| Serbia | 0,2 % | 1,4 % | 9,2 % | 2013 | 98,1 % | 5,8 | 75,5 | |
| Seychelles | 1,1 % | 2,5 % | 6,6 % | 2013 | 95,2 % | 74,7 | ||
| Sierra Leone | 43,0 % | 76,0 % | 92,7 % | 2018 | 48,1 % | 113,5 | 58,2 | |
| Zimbabwe | 39,5 % | 63,8 % | 82,8 % | 2019 | 86,5 % | 56,4 | 58,0 | |
| Slovakia | 0,2 % | 1,0 % | 2,4 % | 2018 | 99,6 % | 5,9 | 77,1 | |
| Slovenia | 0,0 % | 0,0 % | 0,1 % | 2018 | 99,7 % | 2,3 | 78,1 | |
| Spain | 0,9 % | 1,3 % | 2,4 % | 2018 | 98,1 % | 3,3 | 81,7 | |
| Sri Lanka | 0,8 % | 10,1 % | 40,4 % | 2016 | 92,6 % | 9,4 | 76,8 | |
| South Africa | 18,9 % | 37,6 % | 56,9 % | 2014 | 94,3 % | 43,3 | 63,1 | |
| Sudan | 12,2 % | 44,0 % | 79,3 % | 2014 | 75,9 % | 65,1 | 64,1 | |
| South Sudan | 35,0 – 49,9 | 42,7 % | 64,8 % | 84,8 % | 2009 | 31,9 % | 90,7 | |
| Tajikistan | 10,0 – 19,9 | 4,1 % | 17,8 % | 50,3 % | 2015 | 99,8 % | 43,1 | 67,7 |
| Tanzania | 25,0 | 49,4 % | 76,8 % | 91,8 % | 2017 | 80,3 % | 56,7 | 62,2 |
| Thailand | 11,7 | 0,1 % | 0,3 % | 6,2 % | 2019 | 96,7 % | 12,2 | 74,7 |
| Togo | 23,7 | 49,1 % | 73,2 % | 90,1 % | 2015 | 66,5 % | 75,7 | 65,0 |
| Chad | 39,6 | 38,4 % | 66,5 % | 86,3 % | 2011 | 40,2 % | 127,3 | 50,2 |
| Czech Republic | 0,0 % | 0,0 % | 0,2 % | 2018 | >99,9 % | 3,2 | 78,6 | |
| Tunisia | 6,0 | 0,2 % | 3,0 % | 17,5 % | 2015 | 81,8 % | 13,6 | 76,1 |
| Turkey | ≤5,0 | 0,4 % | 2,2 % | 10,2 % | 2019 | 95,0 % | 12,7 | 74,8 |
| Uganda | 41,6 % | 69,6 % | 87,7 % | 2016 | 73,9 % | 53,0 | 55,4 | |
| Ukraine | 6,8 | 0,0 % | 0,2 % | 2,5 % | 2019 | 99,8 % | 9,1 | 71,8 |
| Hungary | 0,2 % | 0,5 % | 2,0 % | 2018 | 99,1 % | 5,2 | 75,9 | |
| Uruguay | ≤5,0 | 0,1 % | 0,4 % | 2,9 % | 2017 | 98,4 % | 9,2 | 77,2 |
| Vanuatu | 13,1 % | 39,4 % | 72,4 % | 2010 | 85,2 % | 73,4 | ||
| Venezuela | 22,2 | 9,2 % | 15,4 % | 31,3 % | 2006 | 95,4 % | 16,3 | 75,8 |
| United States | 1,0 % | 1,2 % | 1,7 % | 2018 | >99,9 % | 6,5 | 79,8 | |
| United Kingdom | 0,3 % | 0,5 % | 0,9 % | 2017 | >99,9 % | 4,3 | 80,7 | |
| Vietnam | 13,6 | 2,0 % | 8,4 % | 29,0 % | 2017 | 94,5 % | 21,6 | 73,4 |
| Central African Republic | 43,0 | 66,3 % | 83,1 % | 92,8 % | 2008 | 36,8 % | 123,6 | 52,3 |
| Cyprus | 0,0 % | 0,2 % | 0,2 % | 2014 | 99,1 % | 2,6 | 78,3 | |
| World | 9,3 % | 24,2 % | 43,5 % | 2017 |
Sources:
Purchasing power per day in $: World Bank
WHI 2021: Global Hunger Index
Literacy rate: CIA Factbook
Infant mortality: World Bank
Life expectancy: UN
Money
Hunger as a result of poverty
In addition to the World Hunger Index, there are various other theories and benchmarks for comparing countries with each other. Many of these are based on concrete figures and monetary units, such as gross domestic product (GDP) or per capita income.
What is not taken into account in all these assessments, however, are the living conditions and opportunities for people and their various social environments. The question arises whether all people have the same preconditions to be able to end their poverty independently and thus fight their hunger.
The "World Poverty Index", which is based on the empowerment approach of the Indian economist Armtya Sen, is therefore interesting. According to Sen, if one wants to evaluate poverty and wealth, it is not enough to compare financial resources or economic growth. The development opportunities for each individual must also be taken into account. For example, good health must be given in order to feel physically fit. Because only then can we learn and work. And through education and gainful employment, people can ultimately fight their poverty and thus also their hunger. According to Sen, these prerequisites should be taken into account when evaluating living situations in countries.
HPI
The Human Poverty Index (HPI)
Amartya Sen's approach serves as the basis for the Human Poverty Index (HPI) established in the 1990s. Since then, this index has been compiled annually by the United Nations to show the prosperity or poverty of various countries and to record it in a ranking list. The value is calculated using a formula that relates life expectancy, education (based on the length of time spent in school) and the income index.
In 2009, HPI was replaced by the Multidimensional Poverty Index (MPI) and has since focused on the dimensions of health, education and living standards.